Associated Protocols and Benchmark Results
Pattern Analysis and Applications, Volume 12, Number 3, 227-236, 2009)
SUSIG is a new online signature database which is available for use in developing or testing signature verification systems. The SUSIG database consists of two parts, collected using different pressure sensitive tablets (one with and one without LCD display). A total of 100 people contributed to each part, resulting in a database of more than 3000 genuine and 2000 skilled forgery signatures.
One of the greatest problems in constructing such a database is obtaining skilled forgeries: people who donate to a database do not have the same motivation, nor the acquired skill of a true forger intent on passing as the claimed identity. In this database, skilled forgeries were collected such that forgers saw the actual signing process played-back on the monitor and had a chance of practicing. ...
We describe the signature acquisition process, approaches used to collect skilled forgeries, and verification protocols which should be followed while assessing performance results. We also report performance of a state of the art online signature verification algorithm using the SUSIG database and the associated protocols. The database is made available for academic purposes.
The SUSIG database consists of two parts: Visual and Blind subcorpora. Signatures in the Visual subcorpus were collected using a pressure sensitive tablet with built in LCD display such that people could see their signatures while signing. On the other hand, no visual feedback was available for the Blind subcorpus.
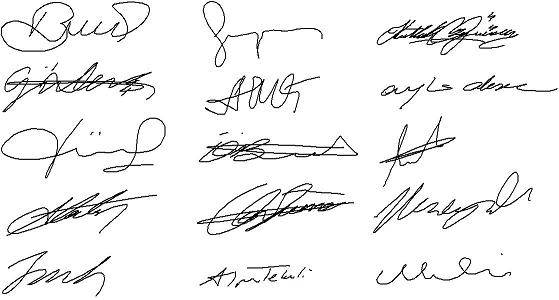
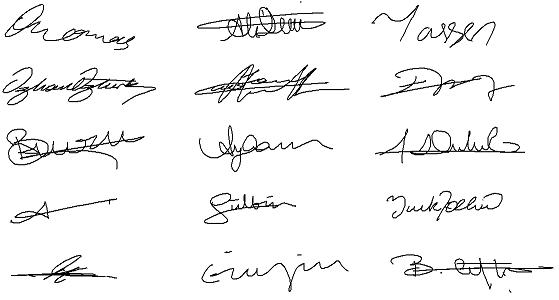
The Blind subcorpus was collected approximately 4 years before the Visual subcorpus; as a result, the people who donated to the two subcorpora are largely different. However, the people who donated signatures are from the same demographics, resulting in similar signature complexity. Samples of the signatures from the Visual and Blind subcorporaare shown in Figures 2 and 3. Signature acquisition setup and the methodology used to collect signatures for the twosubcorpora are explained in detail, in the following subsections.
The signature acquisition hardware that is available in the market can be categorized into 2 major groups: i) smart pens and ii) pressure sensitive tablets. Smart pens generally have force sensors on the pen tip, sensing the movement of the pen and acquiring the signature trajectory while the pen is moving. On the other hand, pressure sensitive tablets perceive pressure exerted by a pen tip onto their surfaces and record its corresponding location. Pressure sensitive tablets themselves can be divided into 2 groups: those with visual feedback provided through an LCD display on the tablet and others without one. Tablets with LCD displays are more comfortable, because people can see what they are signing. On the other hand, tablets without LCDs are cheaper.
Depending on the hardware used, the following features are commonly measured at each particular sample point of a signature trajectory: i) x & y coordinates of the pen tip, ii) pressure (force) exerted, iii) time stamp, iv) azimuth of the pen, v) inclination of the pen with respect to the signing surface. Using these measured features, system developers may extract many other features (such as velocity, acceleration, etc.) as required by their algorithms.
For the Blind subcorpus which was collected first, we used Wacom's Graphire2 pressure sensitive tablet and pen. The tablet's active area is 5.02x3.65 inches with a 1000 lines per inch spatial resolution. It is capable of sampling data at 100 samples per second, recording at each sample point the x, y coordinates of the signature's trajectory, pressure in z-axis (512 levels) and the time stamp. Wacom's pen is featured to capture samples only during the interaction of the pen tip with the tablet.
For the Visual subcorpus, we used Interlink Electronics's ePad-ink tablet which has a pressure sensitive touchpad. The LCD screen dimensions are 3x2.20 inches with a 300 dpi spatial resolution. The tablet has a sampling rate of 100Hz, recording at each sample point the x, y coordinates of the signature's trajectory, pressure in z-axis (128 levels) and the time stamp.
Each signature in the database is saved as a text file, containing the x & y coordinates, time stamp, and pressure level for each point on the signature trajectory.
The Visual subcorpus, which is collected with a tablet with built-in LCD display, consists of signatures donated by 100 unique signers (29 women & 71 men). Most of the signers were students & faculty members of Sabanci University with ages varying between 21 and 52 years old. Each subject was briefly informed of the purpose of the data collection without further information about the working principles of an online signature verification system.
The subjects were first asked to supply samples of their regular signature on the provided pressure sensitive tablet, without any constraints on how to sign. Each signer supplied 20 samples of his/her signature in two different sessions, supplying 10 signatures at each session. There was approximately one week time period in between the two signing sessions.
Each person who donated signatures to the database was then asked to forge someone else's signature at random. For each subject in the Visual subcorpus, we thus collected 5 skilled forgeries by someone else from the same corpus. The forger was given the first signature of SESSION1 of the claimed identity; s/he had a chance to watch the signature's animation several times on the monitor, and practice it a couple of times before forging. The forgers were also able to see the other reference signatures of SESSION1, to understand the variation among the person's signatures (though this was only used by some forgers). After the forgers were satisfied with their skill level, they provided 5 forgeries of the signature they were asked to forge. Forgers were always shown the same reference signature's of the person, in order to make the job easier.
For this subcorpus, we also collected what we call highly skilled forgeries.....
Thus, a total of 10 skilled forgeries (5 skilled and 5 highly skilled) were collected for each person in the Visual subcorpus(see Table 1).
Table 1: Summary of the SUSIG Visual Subcorpus.

The similarity of the forgery signature and reference signatures is measured with the metric used in our benchmark system (Kholmatov and Yanikoglu, 2005). This metric only uses the signature trajectory and the order of the sample points (pressure and time stamps are not used). Hence, while the feedback depends on the specific distance metric of the benchmark system, we think that the quality improvementis absolute since the metric is quite successful in separating forgeries from genuine signatures.

Fig. 2. Sample genuine signatures from the SUSIG Visual Subcorpus.
The Blind subcorpus was collected prior to the Visual subcorpus and is named after the fact that the collection was done on a tablet without LCD display. The subcorpus consists of signatures donated by 100 individuals (25 women & 65 men), most of whom were students & faculty members of Sabanci University, with ages varying between 20 and 50 years old. Each subject was briefly informed of the purpose of the data collection without further information about the working principles of an online signature verification system.
The subjects were first asked to supply samples of their regular signature on the provided pressure sensitive tablet, without any constraints on how to sign. First group of 30 subjects who donated to the Blind subcorpus provided 8 genuine signatures, while the rest of 70 subjects supplied 10 genuine signatures. Both groups supplied their signatures in single session.
Each subject was then asked to forge someone else's signature 10 times. Each forger who is assigned a signature to forge at random, had a chance to watch the signature's animation several times and practiced it a couple of times before forging it. After they were satisfied with their skill level, they gave 10 forgeries of the signature they were asked to forge. For each subject in the Blind subcorpus, we thus collected 10 skilled forgeries. Forgers were always shown the same reference signature's of the person, in order to make the job easier. Table 2 summarizes the Blind subcorpus.
Table 2: Summary of the SUSIG Blind Subcorpus.


Fig. 3. Sample genuine signatures from the SUSIG Blind Subcorpus.

Fig. 4. Sample genuine signatures (on the left) and their corresponding forgeries
(on the right) from the SUSIG Visual Subcorpus (left 2 columns) and the Blind
Subcorpus (right 2 columns).
In this section, we define verification guidelines (protocols), which should be used while assessing and reporting system performance results, using the SUSIG Database.
A verification protocol defines rules which must be followed while assessing a system's performance. In particular, the protocol defines which data should be used for enrolling users to a system (reference set), tuning system specific parameters (validation set) and testing the performance (test set), respectively. In order not to bias the performance results these sets must be disjoint in both user and signature levels. In other words, people who provided signatures to the validation set must not provide any signature to reference nor to test sets. Furthermore, signatures from reference set must not be included in the test set. It is also essential, for an unbiased performance assessment, that all system-wide parameters, in particular those affecting the calculation of similarity scores, are kept fixed once they are trained using the validation set. The only exception to this may be the threshold used to accept or reject a signature given its similarity score(s). This threshold may be decreased or increased to reduce FRR or FAR, respectively, so as to report EER.
We have envisioned 5 genuine signatures to be used as reference signatures, as is the case with the SVC2004 database. However, if a system requires more than 5 reference signatures, most of the protocols may be modified appropriately (adding more of the genuine test signatures to the reference set).
Verification protocols are also designed to assess system performance under various conditions, such as performance results for skilled or random forgery signatures; performance results for signatures acquired using different devices etc. In following sections we define 6 such protocols. Note that some of the protocols are designed for the sake of completeness and compatibility with previous databases (e.g. the single session protocol), while others correspond to more realistic scenarios (e.g. across session protocol). Each protocol can be used with either one of the subcorpora, unless explicitly stated otherwise. However, one should report performance results over a single subcorpus, except for the multi-tablet protocol.
...
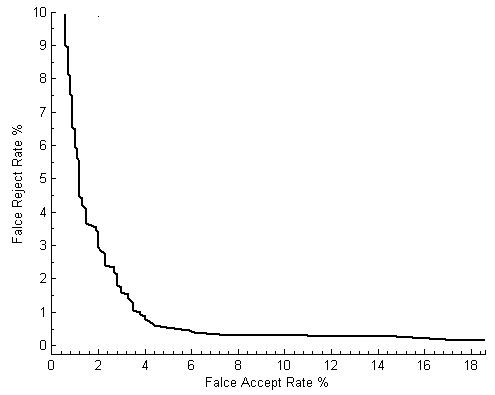
In evaluating the performance of a signature verification system, there are two important factors: the False Rejection Rate (FRR) of genuine signatures and the False Acceptance Rate (FAR) of forgery signatures. As these two errors are inversely related, the equal error rate (EER) where FAR equals FRR are often reported. A more comprehensive information is the Receiver Operating Characteristic (ROC) curve of the system, which is obtained by plotting FRR vs. FAR, while changing the acceptance threshold used to discriminate between genuine & forgery signatures. Note that EER is one point on the ROC curve (which is closest to the origin). Systems using the SUSIG database and protocols should report EER, and optionally the ROC curve of their system and the points on the ROC curve where FAR and FRR values are zero.
Note that in addition to reporting the EER value computed exactly as specified by a particular protocol, it is possible to run leave-k-out tests in accordance with the protocol and report mean and standard deviation of the experiments. For instance, one can randomly choose any 5 signatures of one session as reference (not necessarily the first 5) and use the remaining genuine signatures of the same session and all forgeries, as test signatures, for the Single Session protocol of the Visual subcorpus. In this case, one can run as many as 2(10!/5!5! ) = 504 experiments. However, given that there are more than 1800 signatures to test in the various protocols, we believe that the suggested protocols have enough data to be statistically significant as specified. As mentioned before, it is essential for an unbiased testing to keep all system-wide parameters except for the acceptance threshold, fixed once they are trained using the corresponding validation set.
In order to comment on relative difficulties of the various protocols and provide a baseline on the SUSIG database, we report performance results of our signature verification algorithm (Kholmatov and Yanikoglu, 2005). This system received first place at the First International Signature Verification Competition, SVC2004 Yeung et al. (2004).
Table 4 contains results obtained using our benchmark system and the SUSIG protocols. In particular, the results are 2.10% ERR on the base protocol of the Visual Subcorpus. Figure 5 presents the ROC curve for this experiment.
...

Fig. 5. ROC curve indicates verification performance for different thresholds using
the SUSIG Base Protocol & the Visual subcorpus.
...
The SUSIG online signature database is publicly available (free of charge) to the research community. Unfortunately, due to privacy reasons, we cannot provide the database for commercial use.
Those interested in obtaining SUSIG database should send a request email from their institutional account, to [alisher at sabanciuniv dot edu], providing the following information:
1. Name, Surname
2. Affiliated Institution
3. Where do you plan using SUSIG (research, commercial)
While reporting results using the SUSIG database, please cite the following article:
@article{SUSIG,
author="Kholmatov, A. and Yanikoglu, B.",
Title="SUSIG: an on-line signature database, associated protocols and benchmark results",
journal="Pattern Analysis and Applications",
volume = {12},
number = {3},
year = {2009},
pages = {227-236}
}
Download Validation Data Sets (doesn't require request email)
1. Visual Subcorpus (will be available very soon)
2. Blind Sucorpus (will be available very soon)
Download the full data set after acquiring the password
Download